Structured logging with Serilog and Seq and Event Viewing with Elasticsearch Logstash Grafana and Opserver in Docker
Tuesday, January 31, 2023
Structured logging to a dotnet core Web API project using Serilog and Seq and Event Viewing with Elasticsearch, Logstash, Grafana and Opserver in Docker
#docker #dotnet-core #elasticsearch #entity-framework-core #grafana #logstash #mssql #opserver #seq #serilog #web-api
This article is published at GitHub.You can raise issues, create pull requests or even fork the content...its open source.
In this article, you will learn how to add Structured logging to a dotnet core Web API project using Serilog, Seq and Event Viewing with Elasticsearch, Logstash, Grafana and Opserver in Docker containers.
Prerequisites
The following prerequisites will be required to complete this tutorial:
- Visual Studio 2022 Community with the ASP.NET and web development workload. If you don't have Visual Studio installed, download Visual Studio for free before you begin.
- Windows Subsystem for Linux (WSL). If you don't have WSL installed, download Docker WSL for free before you begin.
- Docker Desktop. If you don't have Docker Desktop installed, download Docker Desktop for free before you begin.
Create a Web API Project in Visual Studio with Docker support
Open Visual Studio.
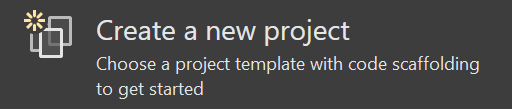
Select Create a new project.
Search for core web api, and then select ASP.NET Core Web API, and then select Next.

Enter the following values in the Configure your new project window, and then select Next.
Parameter Value Project Name Monitored.API Location Location of your choice Solution name MonitoredDockerStack Place solution and project in the same directory Unchecked 
Enter the following values in Additional information, and then select Create.
Parameter Value Framework .NET 6.0 (Long-term support) Authentication type None Configure for HTTPS Checked Enable Docker Checked Docker OS Linux Use controllers (uncheck to use minimal APIs) Checked Enable OpenAPI Checked 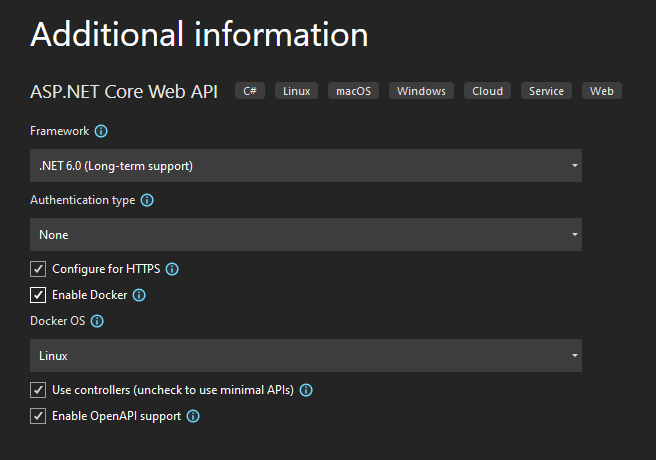
Install the following nuget packages for Serilog, Seq, Elastic Search and MS SQL Database support
In Visual Studio, select Tools > Nuget Package Manager > Package Manager Console.
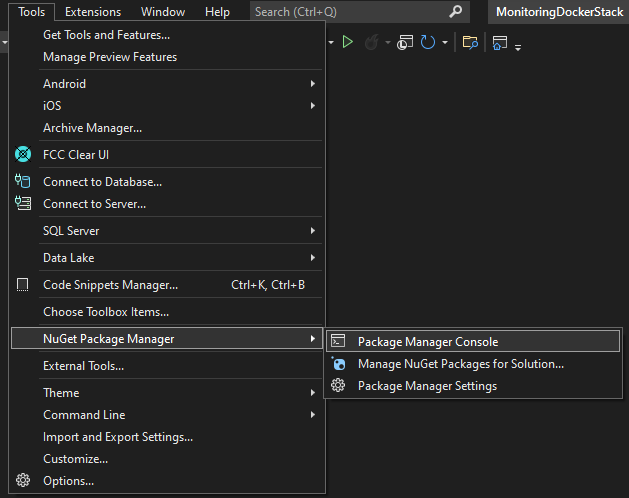
Enter the following.
Install-Package Serilog.AspNetCore
Install-Package Serilog.Sinks.Seq
Install-Package Serilog.Sinks.ElasticSearch
Install-Package Elastic.Apm.SerilogEnricher
Install-Package Microsoft.EntityFrameworkCore.SqlServer
Install-Package AutoFixture
Enable Serilog in program.cs
Add the following code to the
program.csundervar builder = WebApplication.CreateBuilder(args);.builder.Host.UseSerilog((context, logger) => logger .WriteTo.Console() .WriteTo.Elasticsearch(new ElasticsearchSinkOptions(new Uri(context.Configuration["ElasticSearch:ServerUrl"])) { AutoRegisterTemplate = true, AutoRegisterTemplateVersion = AutoRegisterTemplateVersion.ESv7, FailureCallback = e => Console.WriteLine($"Unable to submit event to Elasticsearch {e.MessageTemplate}"), }) .Enrich.WithElasticApmCorrelationInfo() .ReadFrom.Configuration(context.Configuration));
Add database to the project
Add a model to define the database entity
Add the following model class
WeatherForecastinto theDatafolder.public class WeatherForecast { public int Id { get; set; } public DateTime Date { get; set; } public int TemperatureC { get; set; } public int TemperatureF => 32 + (int)(TemperatureC / 0.5556); public string? Summary { get; set; } }
Add a database context
Add the following class
MonitoredAPIDataContextinto theDatafolder.public class MonitoredAPIDataContext : DbContext { public MonitoredAPIDataContext(DbContextOptions<MonitoredAPIDataContext> options) : base(options) { Database.EnsureCreated(); this.Seed(); } public DbSet<WeatherForecast> WeatherForecasts { get; set; } }
Seed the database
Add the following class
Seederinto theDatafolder.// This is demo code, don't do this in a production application! public static void Seed(this MonitoredAPIDataContext monitoredAPIDataContext) { if (!monitoredAPIDataContext.WeatherForecasts.Any()) { Fixture fixture = new Fixture(); fixture.Customize<WeatherForecast>(weatherForecast => weatherForecast.Without(p => p.Id)); // The next two lines add 100 rows to your database List<WeatherForecast> weatherForecasts = fixture.CreateMany<WeatherForecast>(100).ToList(); monitoredAPIDataContext.AddRange(weatherForecasts); monitoredAPIDataContext.SaveChanges(); } }
Register the database context
Add the following code to the
program.csclass after the comment// Add services to the container..builder.Services.AddDbContext<MonitoredAPIDataContext>(options => options.UseSqlServer(builder.Configuration.GetConnectionString("monitoredapidb")));
Replace the code in WeatherController.cs
Replace the code in the
WeatherController.private readonly ILogger<WeatherForecastController> _logger; private readonly MonitoredAPIDataContext _monitoredAPIDataContext; public WeatherForecastController(ILogger<WeatherForecastController> logger, MonitoredAPIDataContext monitoredAPIDataContext) { _logger = logger; _monitoredAPIDataContext = monitoredAPIDataContext; } [HttpGet(Name = "GetWeatherForecast")] public ActionResult Get(int take = 10, int skip = 0) { _logger.LogInformation("Starting Get request"); return Ok(_monitoredAPIDataContext.WeatherForecasts.OrderBy(p => p.Id).Skip(skip).Take(take)); }
Replace app settings JSON
Replace the JSON in the
appsettingsandappsettings.Development.{ "AllowedHosts": "*", "Serilog": { "Properties": { "Application": "Monitored.API" }, "WriteTo": [ { "Name": "Seq", "Args": { "serverUrl": "http://seq", "apiKey": "<secret>" } } ], "MinimumLevel": { "Default": "Debug", "Override": { "Microsoft": "Debug", "Monitored.API": "Debug", "System": "Warning", "Microsoft.Hosting.Lifetime": "Information" } } }, "ElasticSearch": { "ServerUrl": "http://elasticsearch:9200" }, "ConnectionStrings": { "monitoredapidb": "Server=sqldata;Database=monitoredapi;User Id=sa;Password=Pass@word;Encrypt=False" } }
Add Docker compose project to the solution
Right click on the Web API project, and then select Add > Docker Support.
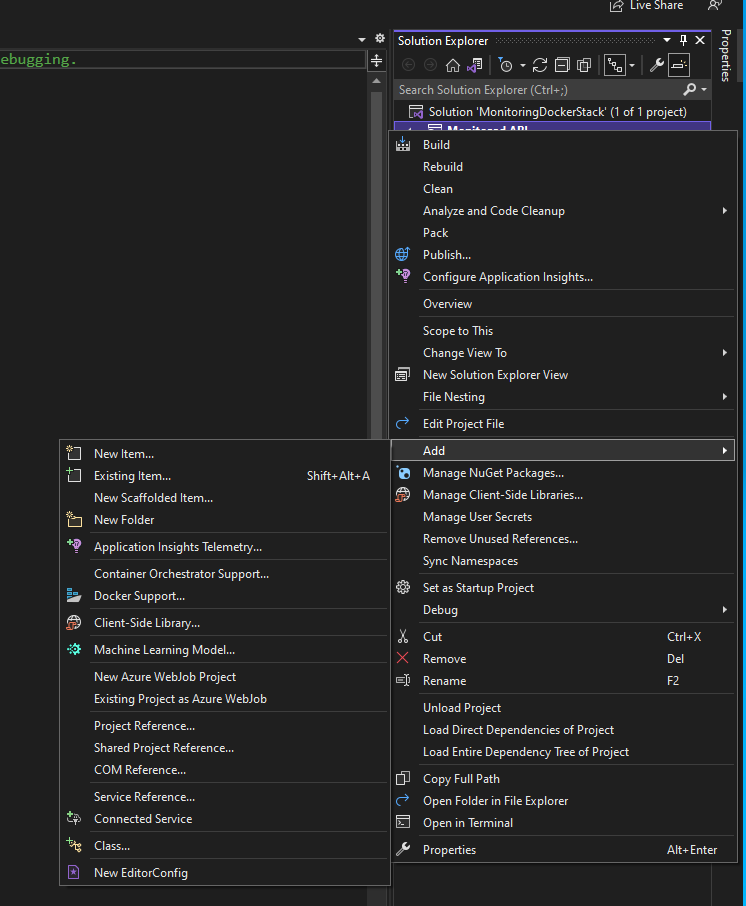
Select Docker Compose, and then OK.
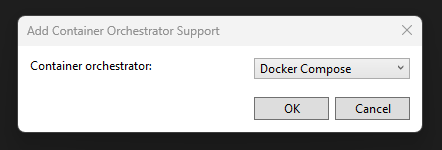
Select Linux, and then OK.

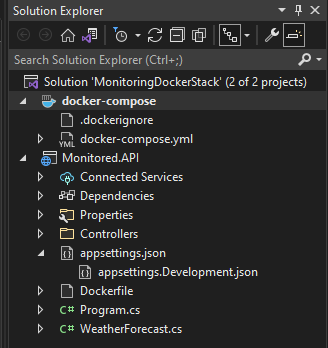
A docker-compose project will be added to the solution.
Define container applications in Docker compose
Replace the yaml in the
docker-composeyaml file.version: '3.4' services: monitored.api: image: ${DOCKER_REGISTRY-}monitoredapi build: context: . dockerfile: Monitored.API/Dockerfile depends_on: - sqldata sqldata: image: mcr.microsoft.com/mssql/server:2022-latest seq: image: datalust/seq:latest elasticsearch: image: docker.elastic.co/elasticsearch/elasticsearch:7.17.8 grafana: image: grafana/grafana-oss:latest depends_on: - elasticsearch opserver: image: opserver/opserver:preview1 depends_on: - sqldata - elasticsearchReplace the yaml in the
docker-compose.overrideyaml file.version: '3.4' services: monitored.api: container_name: monitoredapi environment: - ASPNETCORE_ENVIRONMENT=Development - ASPNETCORE_URLS=https://+:443;http://+:80 ports: - "5020:80" - "5021:443" volumes: - ${APPDATA}/Microsoft/UserSecrets:/root/.microsoft/usersecrets:ro - ${APPDATA}/ASP.NET/Https:/root/.aspnet/https:ro - ~/.vsdbg:/remote_debugger:rw sqldata: container_name: sqldata environment: - SA_PASSWORD=Pass@word - ACCEPT_EULA=Y ports: - "1433:1433" seq: container_name: seq environment: - ACCEPT_EULA=Y ports: - "5340:80" volumes: - /data:/data restart: always elasticsearch: container_name: elasticsearch restart: always ports: - 9200:9200 environment: - discovery.type=single-node - network.host=0.0.0.0 - xpack.security.enabled=false volumes: - ./deploy/elg/elasticsearch:/usr/share/elasticsearch/data:rw ulimits: memlock: soft: -1 hard: -1 grafana: container_name: grafana ports: - "3000:3000" volumes: - ./deploy/elg/grafana/provisioning:/etc/grafana/provisioning:rw restart: always opserver: container_name: opserver ports: - "4001:80" volumes: - ./deploy/opserver/config:/app/Config
Create configuration for ElasticSearch, Logstash and Grafana (ELG)
Create ELG folder structure
Create a deploy folder in the root of the solution with the following folders in it elasticsearch, logstash and grafana.
Create ElasticSearch configuration
- Create a new folder named config in the elasticsearch folder and add the following yaml file
elasticsearch.## Default Elasticsearch configuration from elasticsearch-docker. ## from https://github.com/elastic/elasticsearch-docker/blob/master/build/elasticsearch/elasticsearch.yml # cluster.name: "docker-cluster" network.host: 0.0.0.0 # minimum_master_nodes need to be explicitly set when bound on a public IP # set to 1 to allow single node clusters # Details: https://github.com/elastic/elasticsearch/pull/17288 discovery.zen.minimum_master_nodes: 1 ## Use single node discovery in order to disable production mode and avoid bootstrap checks ## see https://www.elastic.co/guide/en/elasticsearch/reference/current/bootstrap-checks.html # discovery.type: single-node xpack.security.enabled: false
Create Grafana configuration
Create a new folder named provisioning in the grafana folder.
Create a new folder named dashboards in the provisioning folder and add the following yaml file
dashboards.apiVersion: 1 providers: - name: 'monitoredapi' folder: 'monitoredapi' type: file options: path: /etc/grafana/provisioning/dashboards/monitoredapiCreate a new folder named monitoredapi in the dashboards folder and add Monitored API Dashboard JSON file.
Create a new folder named datasources in the provisioning folder and add the following yaml file
datasources.apiVersion: 1 datasources: - name: elasticsearch type: elasticsearch access: proxy database: "[logstash-]YYYY.MM.DD" url: http://elasticsearch:9200 jsonData: interval: Daily timeField: "@timestamp" logLevelField: level logMessageField: line esVersion: 7.17.8
Create configuration for Opserver
Create a new folder named opserver in the deploy folder.
Create a new folder named config in the opserver folder and add the following JSON file
opserverSettings.{ "ForwardedHeaders": { "KnownNetworks": [ "10.0.0.0/16" ], "KnownProxies": [], "ForwardedHeaders": "All" }, "Security": { // This is demo code, don't do this in a production application! "provider": "EveryonesAnAdmin" }, "Modules": { /* Configuration for the SQL Server dashboard */ "Sql": { "defaultConnectionString": "Server=$ServerName$;Database=master;User Id=sa;Password=Pass@word;Encrypt=False", "refreshIntervalSeconds": 30, "instances": [ { "name": "sqldata" } ] }, /* Configuration for the Redis dashboard */ "Redis": { }, /* Configuration for the Elastic dashboard */ "Elastic": { "clusters": [ { "name": "docker-cluster", "refreshIntervalSeconds": 20, "nodes": [ "elasticsearch" ] } ] }, /* Configuration for the Exceptions dashboard */ "Exceptions": { "stackTraceReplacements": [ { "name": "github", "pattern": "(?<= in )https?://raw.githubusercontent.com/([^/]+/)([^/]+/)([^/]+/)(.*?):line (\\d+)", "replacement": "<a href=\"https://github.com/$1$2blob/$3$4#L$5\">$4:line $5</a>" } ] } } }
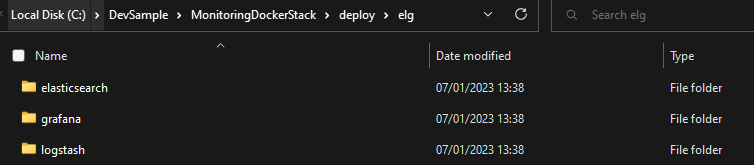
Folder structure and configuration files for ELG and Opserver
After completing the steps above the final folder structure and config files will look like the following.

Testing
Run Docker stack
Right click on the
MonitoredDockerStackSolution and select Open in Terminal.
Run the following command in the Terminal.
docker compose -f docker-compose.yml -f docker-compose.override.yml up -d --build --force-recreate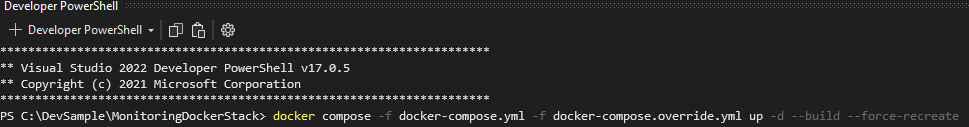
Test Web API
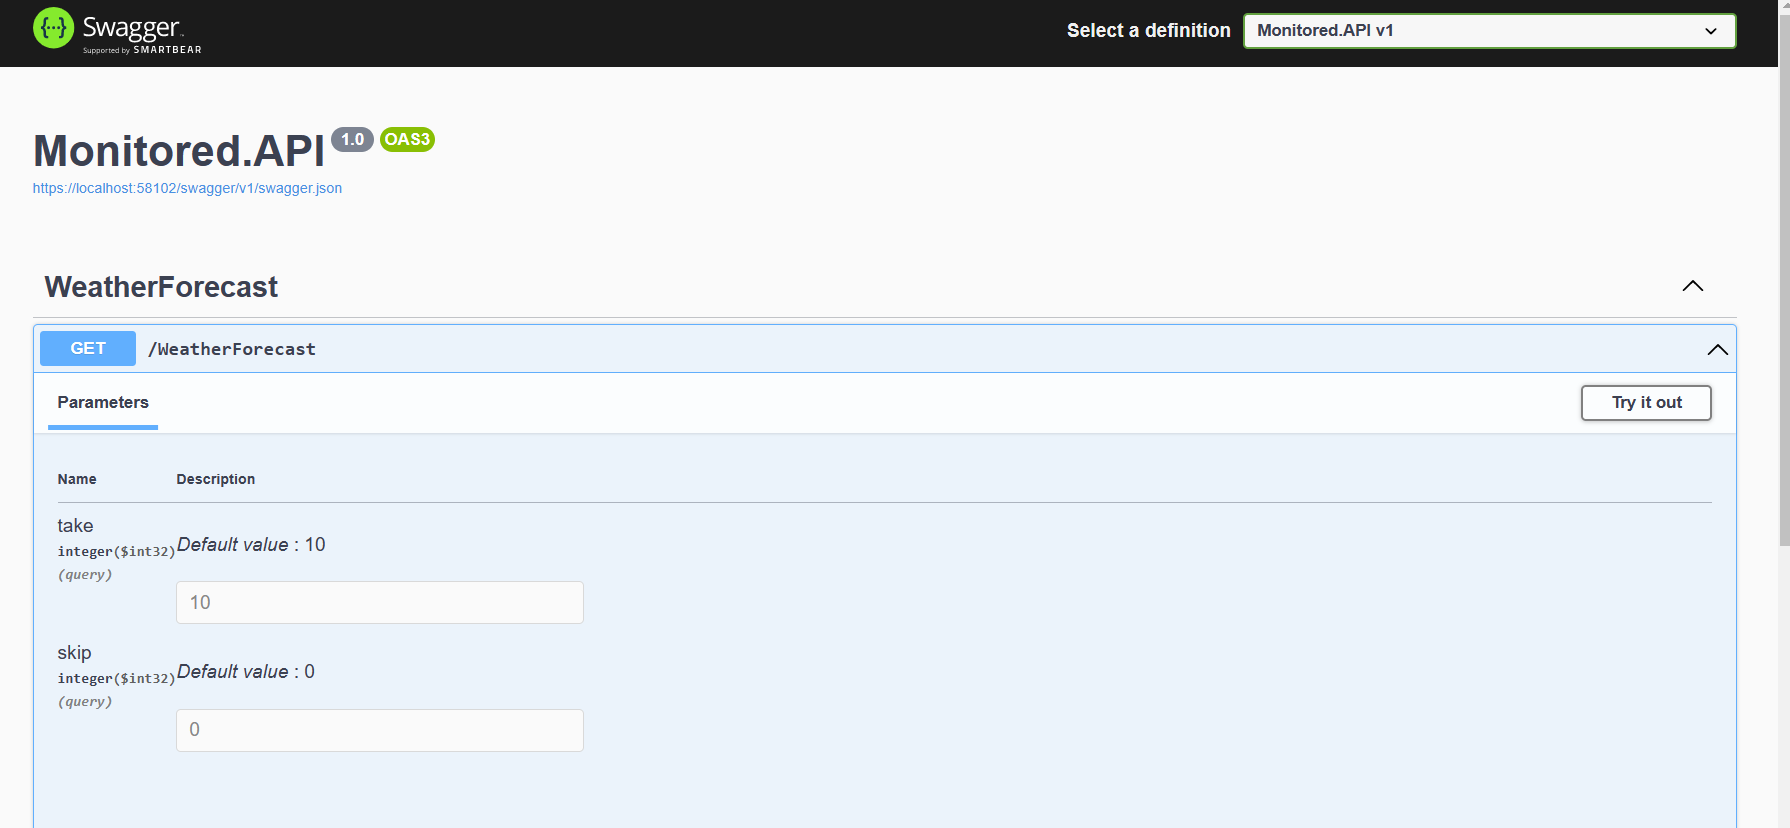
Browse to https://localhost:5021/swagger/index.html.
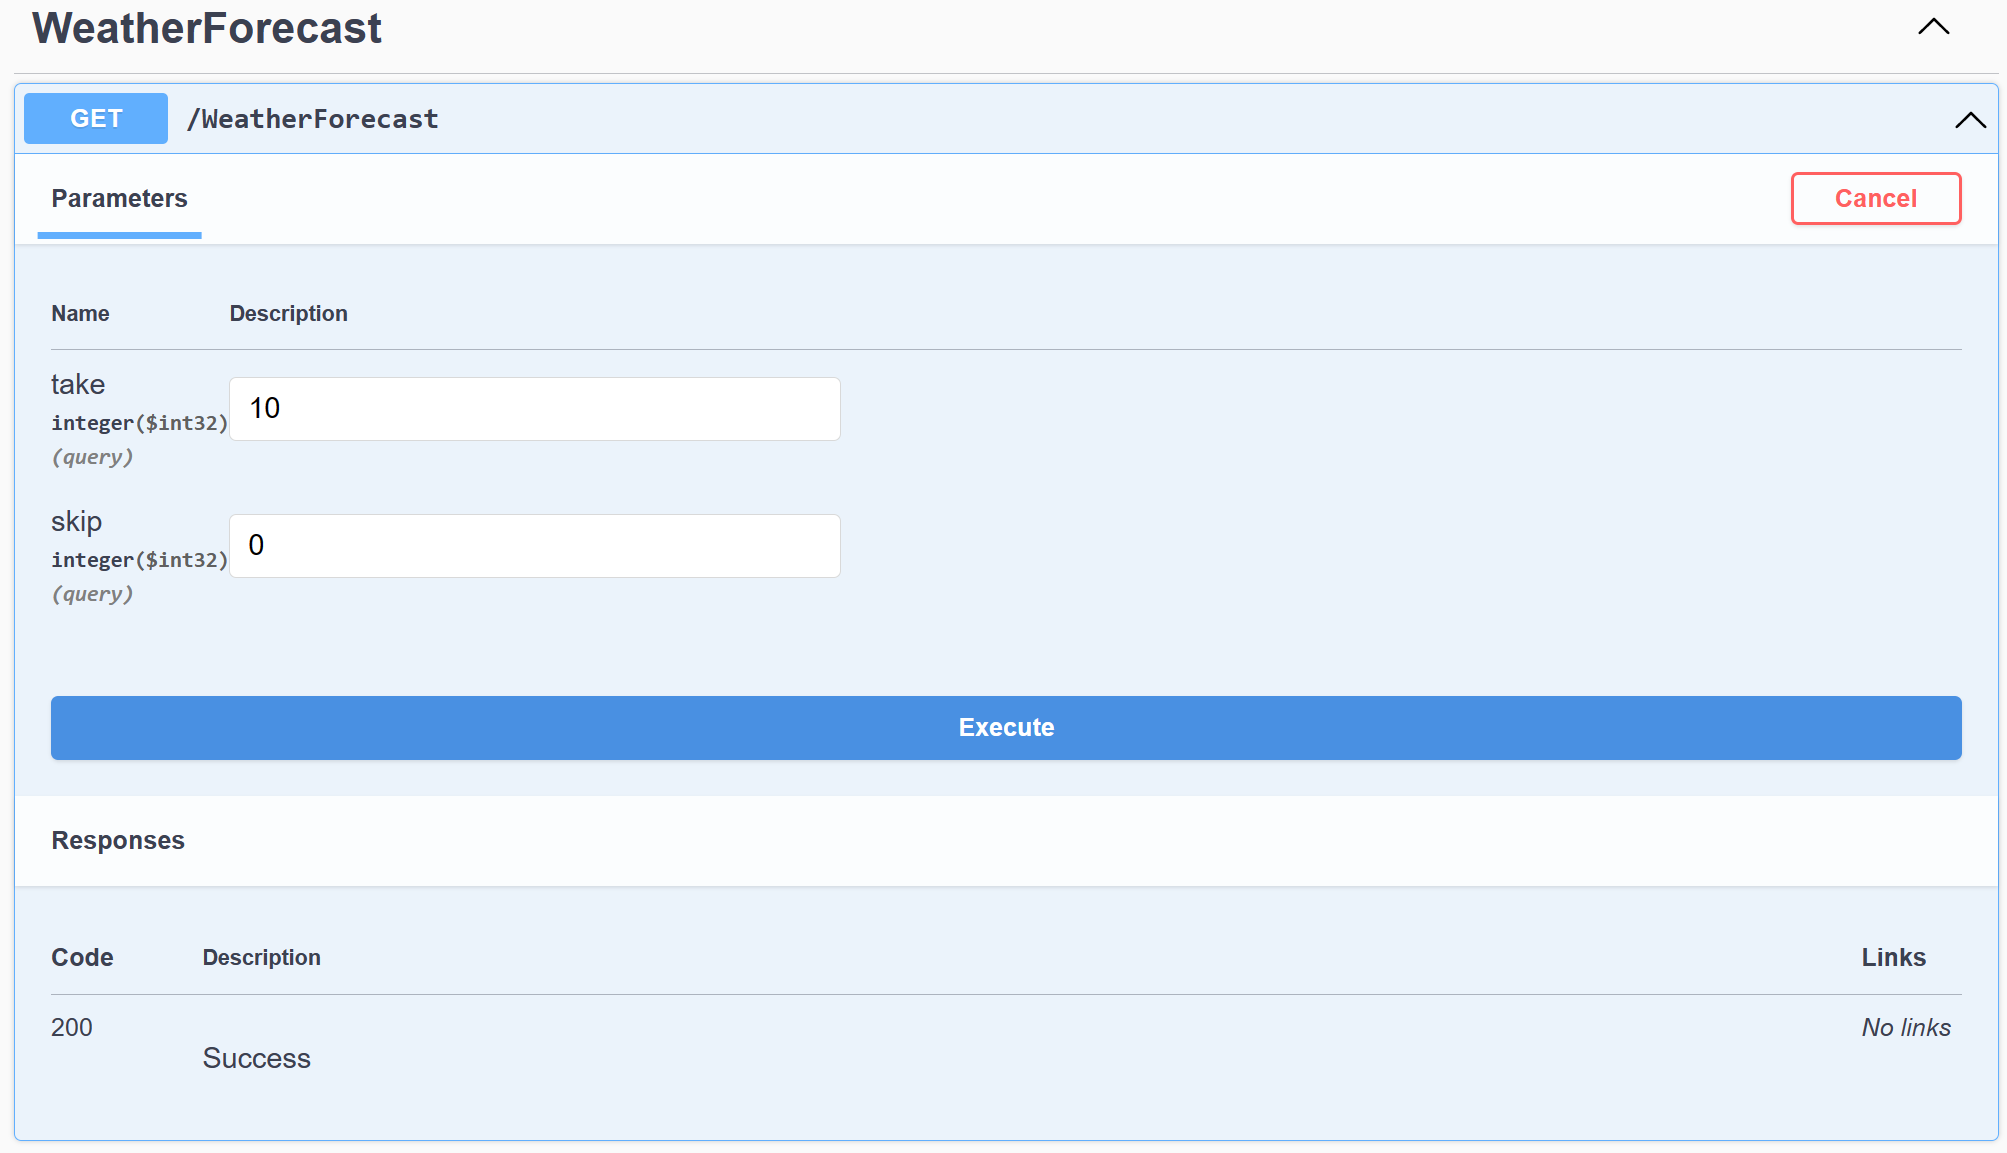
Expand GET /WeatherForecast, and then select Try it out.
Select Execute.
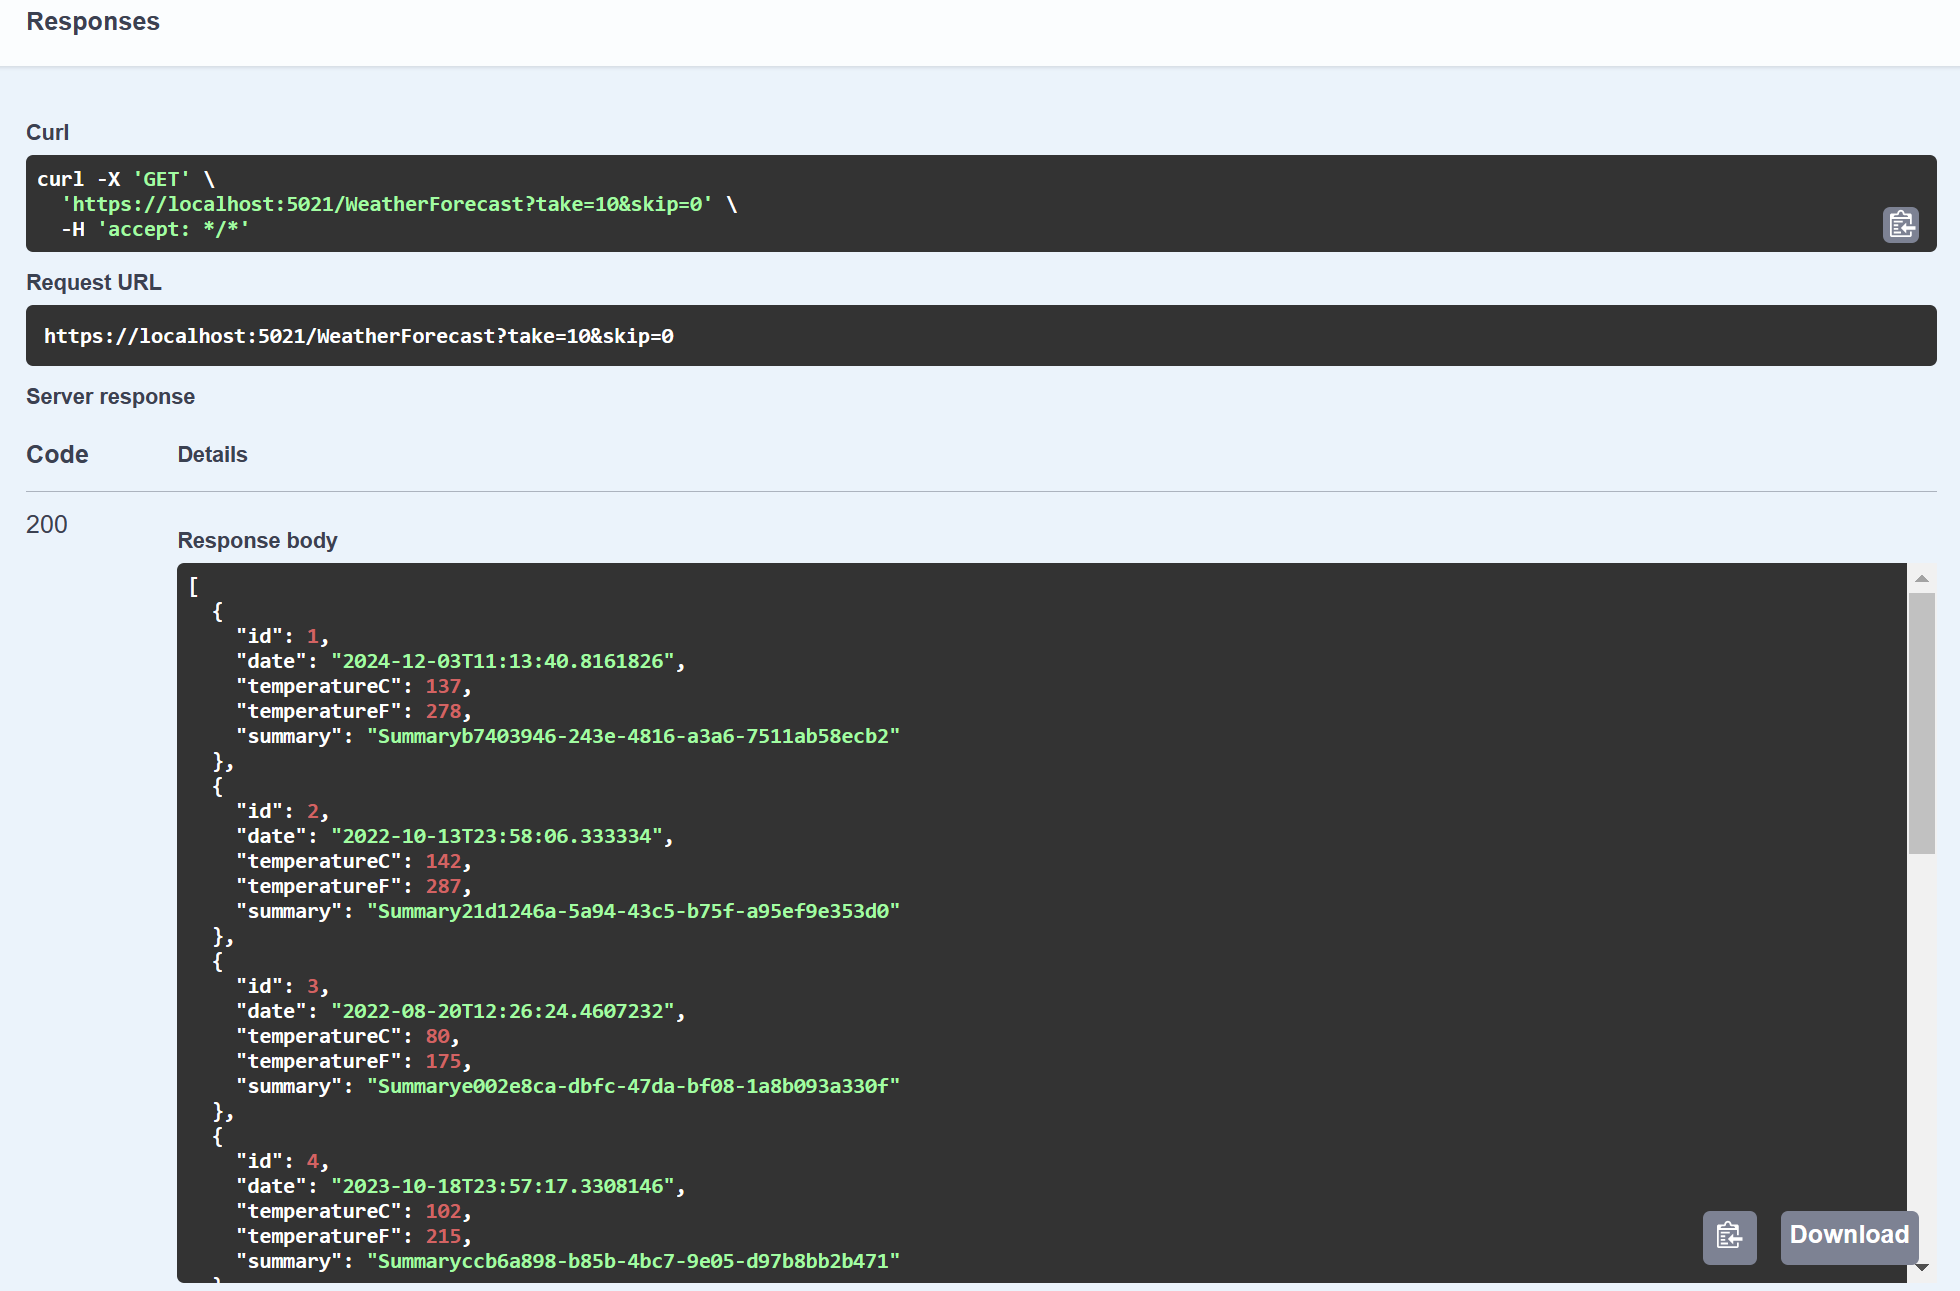
The following response with be displayed.
Test Grafana
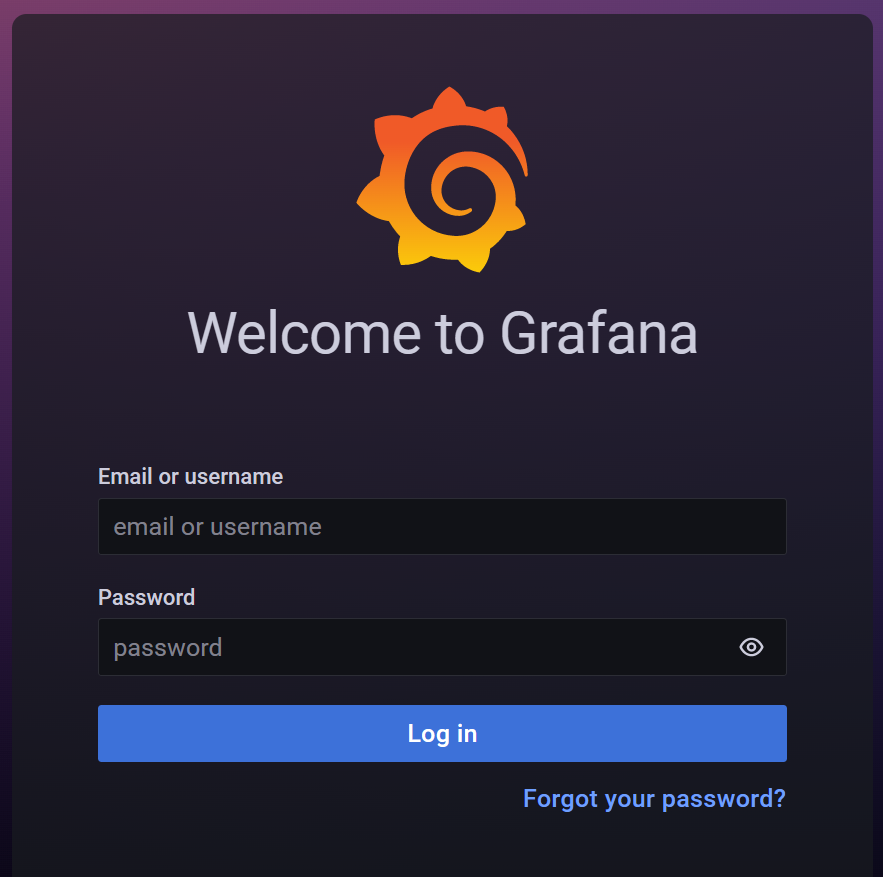
Browse to http://localhost:3000/.
Enter the default username and password admin / admin, and then select Log in.
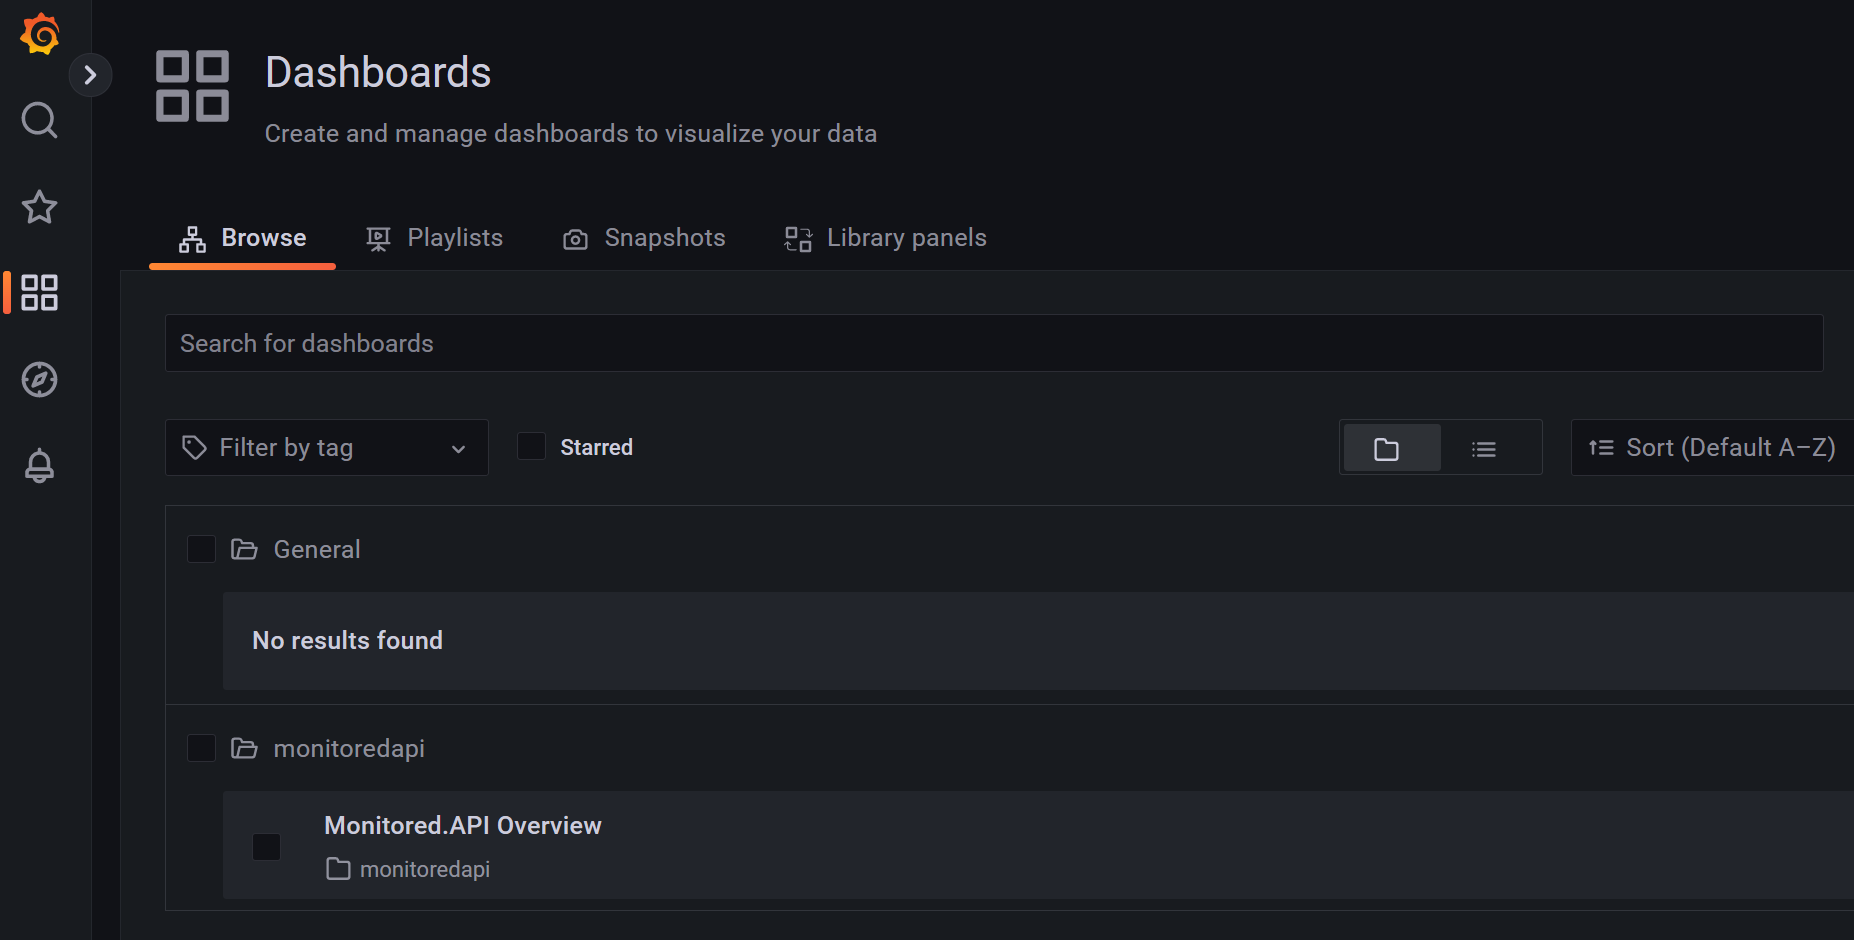
In Navigation on the left of the screen, select the Dashboards icon.

Select Monitored.API Overview.
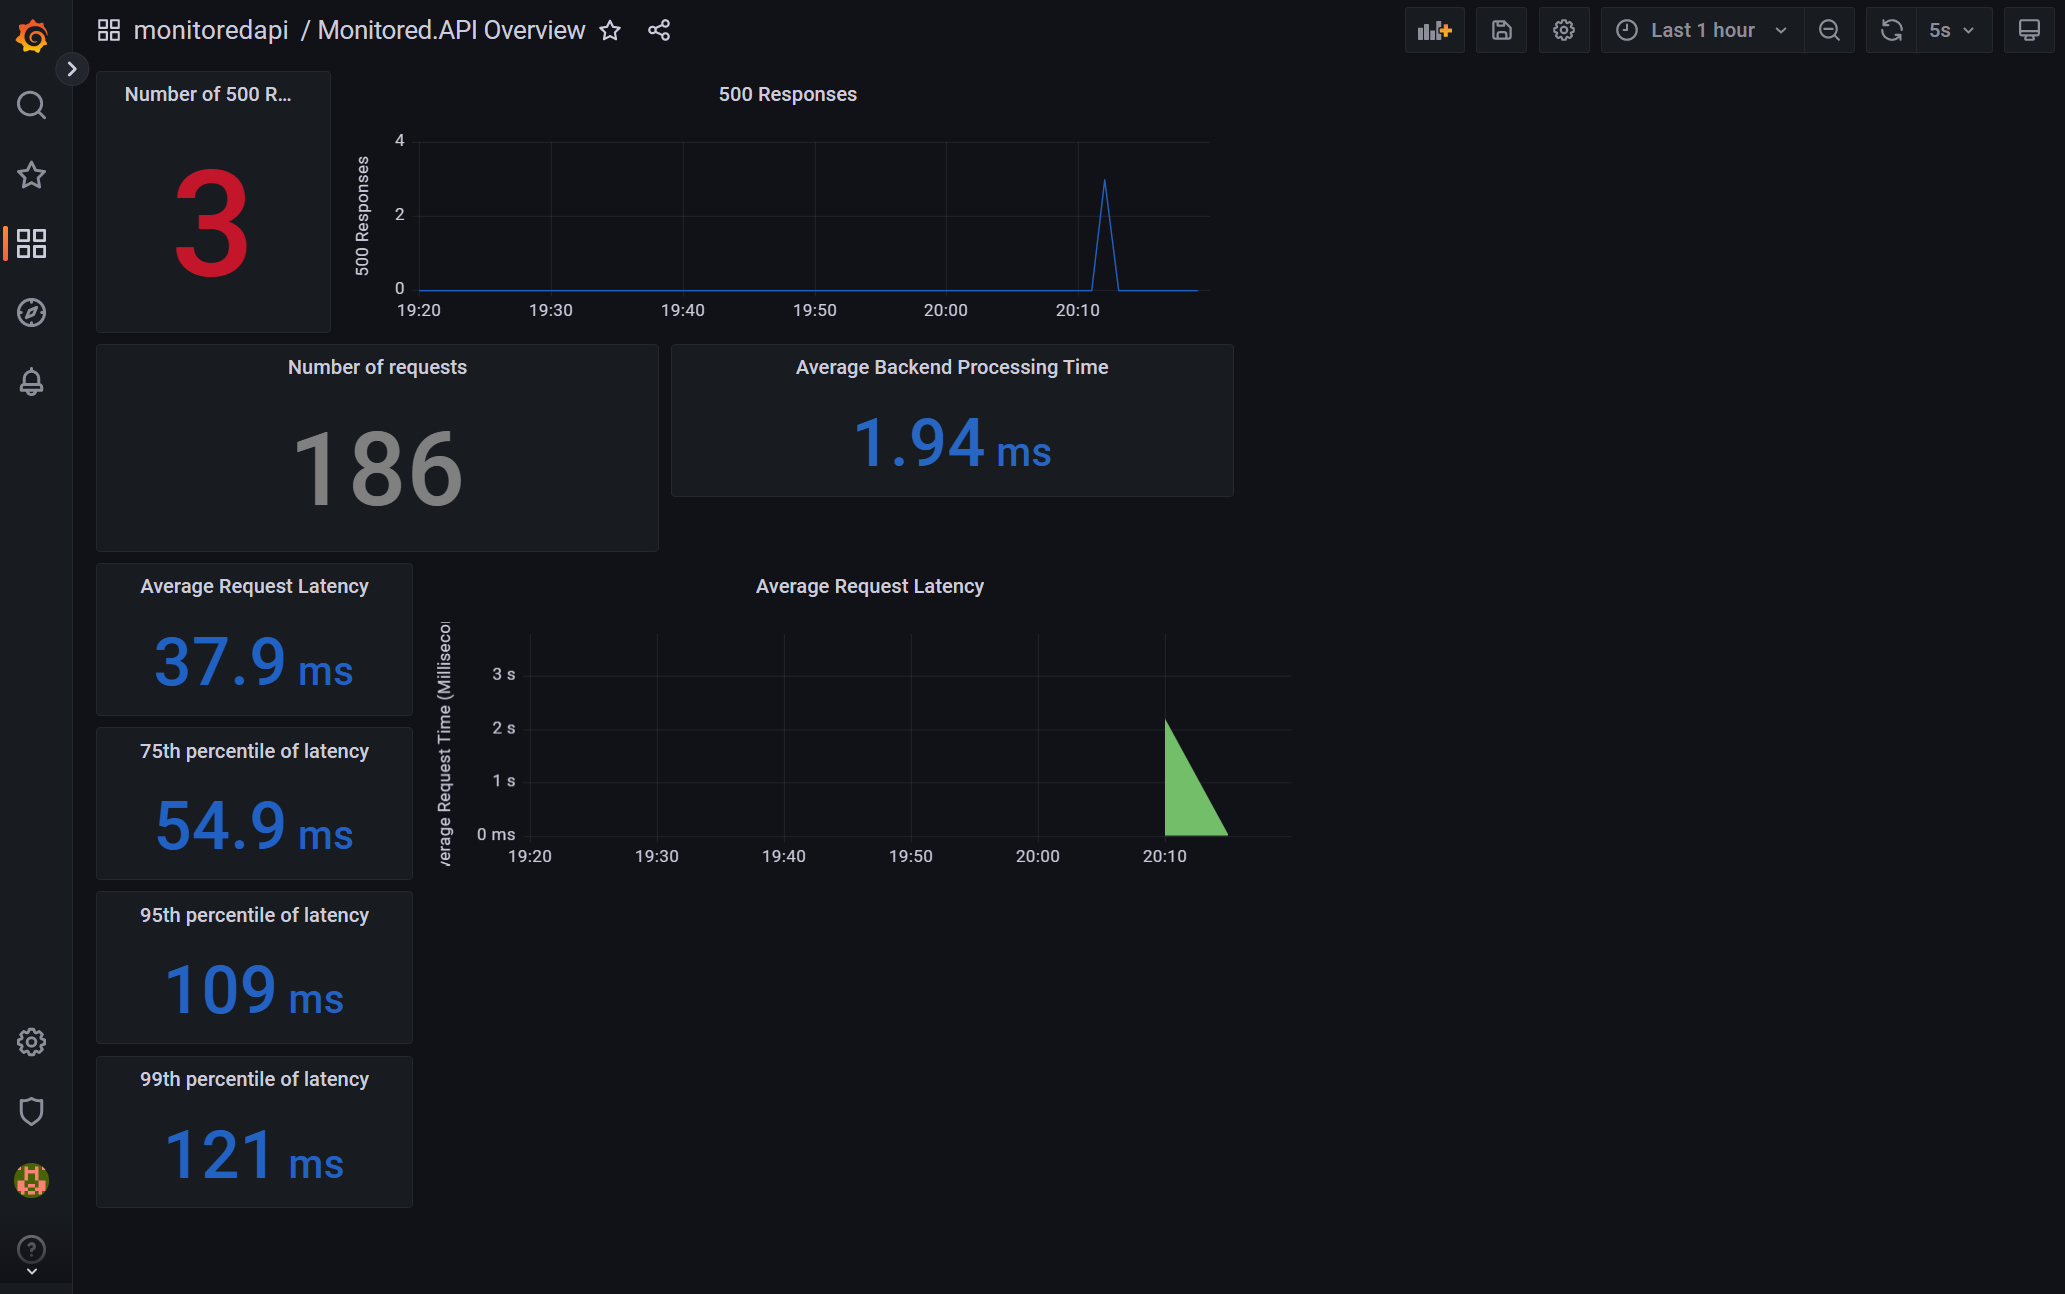
View the Monitored.API Overview Dashboard.
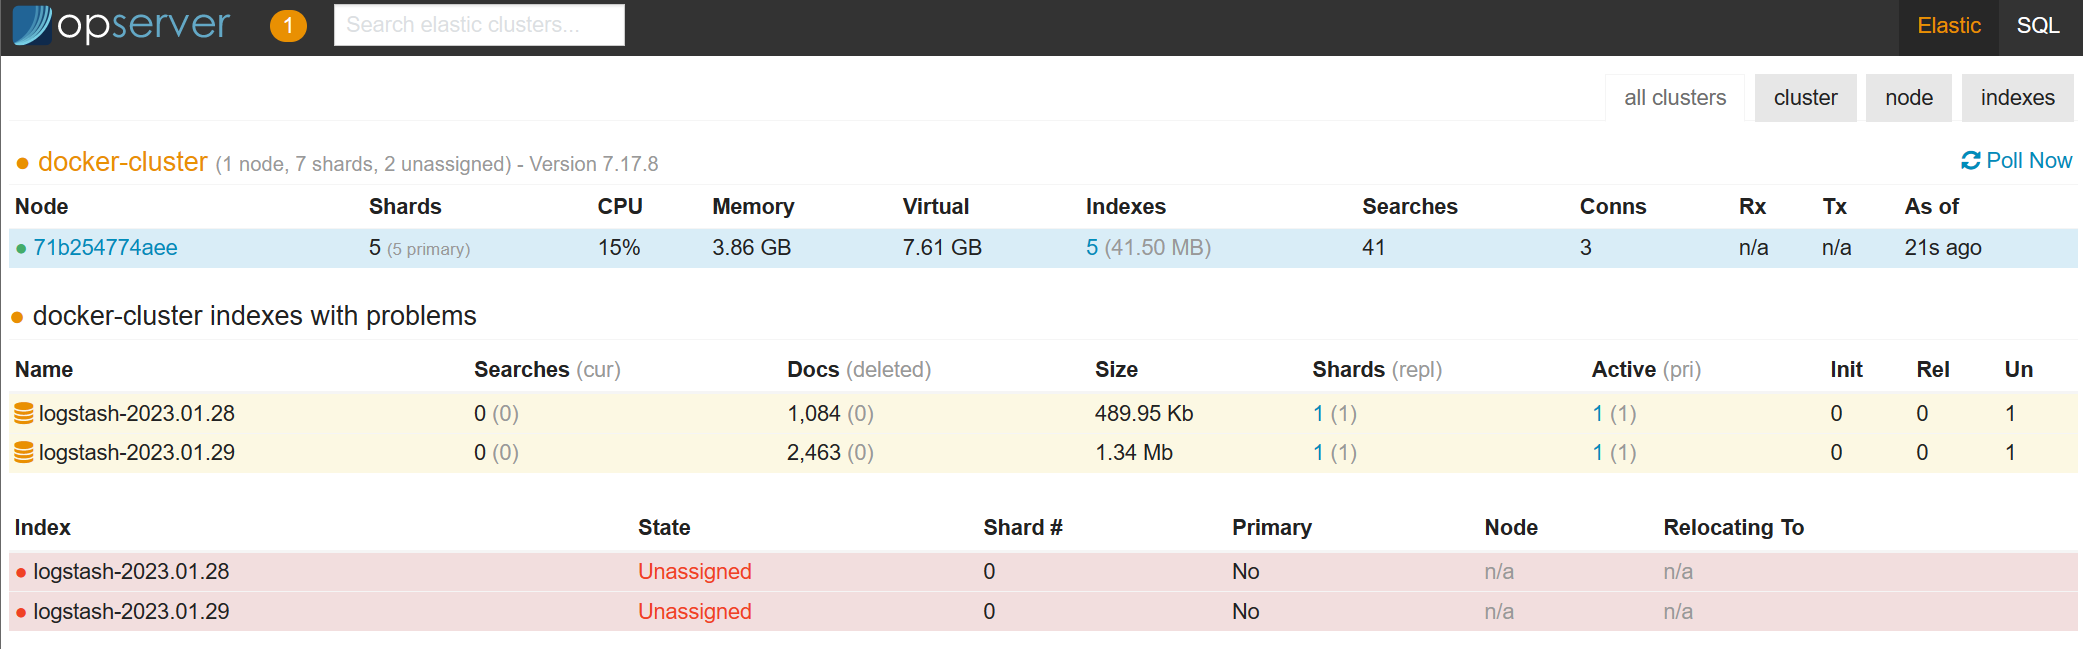
Test Opserver
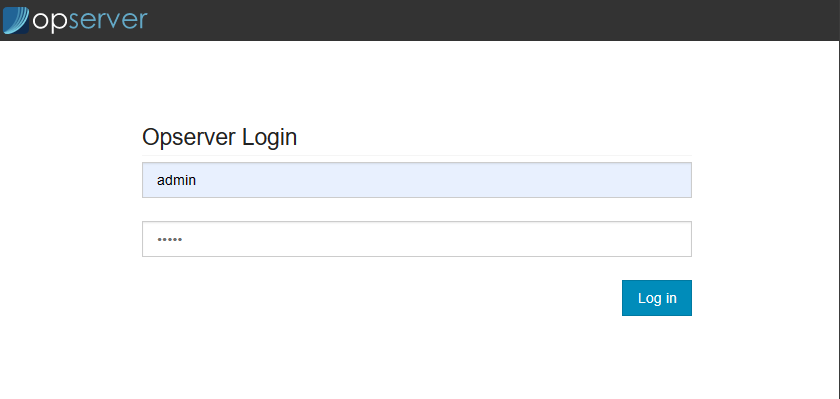
Browse to http://localhost:4001/.
Enter the default username and password admin / admin, and then select Log in.
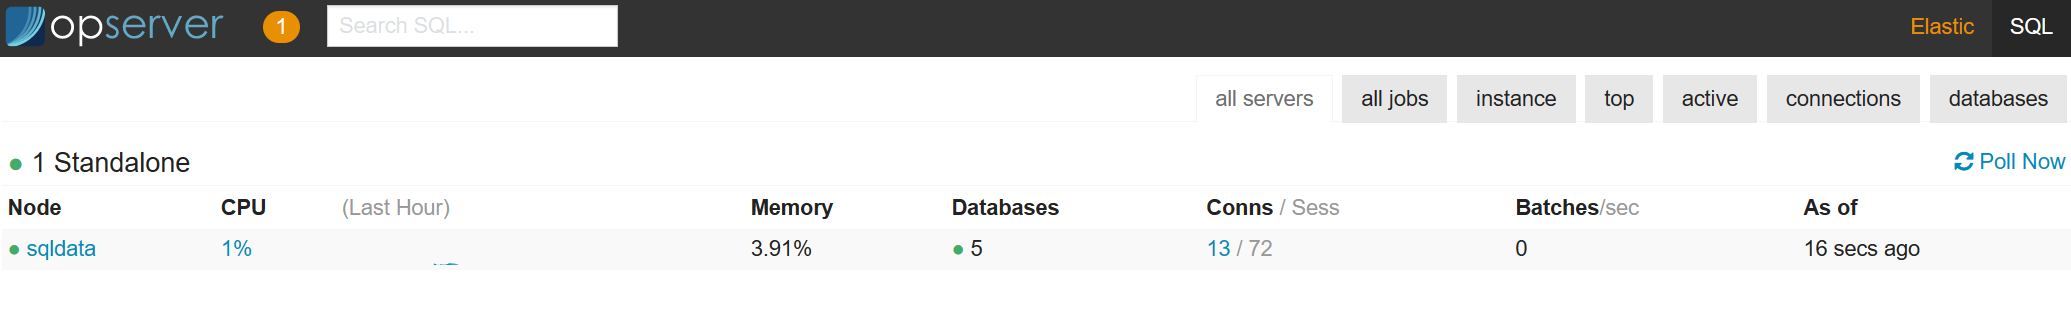
Select SQL in the top right hand corner of the screen for the SQL overview.
Select Elastic in the top right hand corner of the screen for the Elastic overview.
Got a comment?
All my articles are written and managed as Markdown files on GitHub.
Please add an issue or submit a pull request if something is not right on this article or you have a comment.
If you'd like to simply say "thanks", then please send me a so the rest of Twitter can see how awesome my work is.